
The bootstrap method can be used to calculate confidence interval for the average from each sample for the given confidence level. Confidence probability is calculated by subtracting the significance level value from one. The subsamples may vary in sizes.
Use this method to compare an average with a constant. For comparing one average with an average from another subsample, use comparing averages technique.
Subsamples with 3-4 observation can be used only for the preliminary data analysis. In order to achieve confidence probability 0.9 or above you have to have no less then five samples; for 0.95 – at least 6 samples, for 0.99 – 8 or more.
Note. If the lower line for the subsample has a confidence probability lower that the set value, then, due to small sample size, it is impossible to determine the confidence interval for the set confidence probability.
After indicating the basic data area and the results area, select from the dropdown menu “Confidence Interval” and press the "Next >>" button.
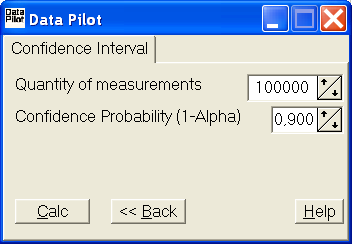
Here you have to select confidence probability value (one minus the significance level) and the number of repetitions. More repetitions mean higher precision level for the results and longer calculations time.
The "<< Back" button allows users to come back to the original data and calculation method selection.
Press the “Calc” button to start calculations.

During the process of calculation, a progress window appears. The “Cancel” button allows user to stop the calculations. After the calculation is complete, you get the results.

You can compare the results by using Compare Samples option. In spite of the fact that 90% confidence intervals for “C Mag” and “M 49” intersect, there is a 98% probability that the “M49” average is higher than the “C Mag” average.
This method allows comparing averages with constants; for example, it can be used to determine with grape sorts have average harvest value more than 15. Take a note of the fact that with a confidence probability of 0.9 we can not say that of the sort “M control”.